AI News
METR Estimates Faster AI Research at Anthropic, With Important Uncertainty
METR’s new assessment is a reason to examine AI-assisted research more closely. Its headline estimate describes a changing rate of progress, with substantial uncertainty.
What the report says
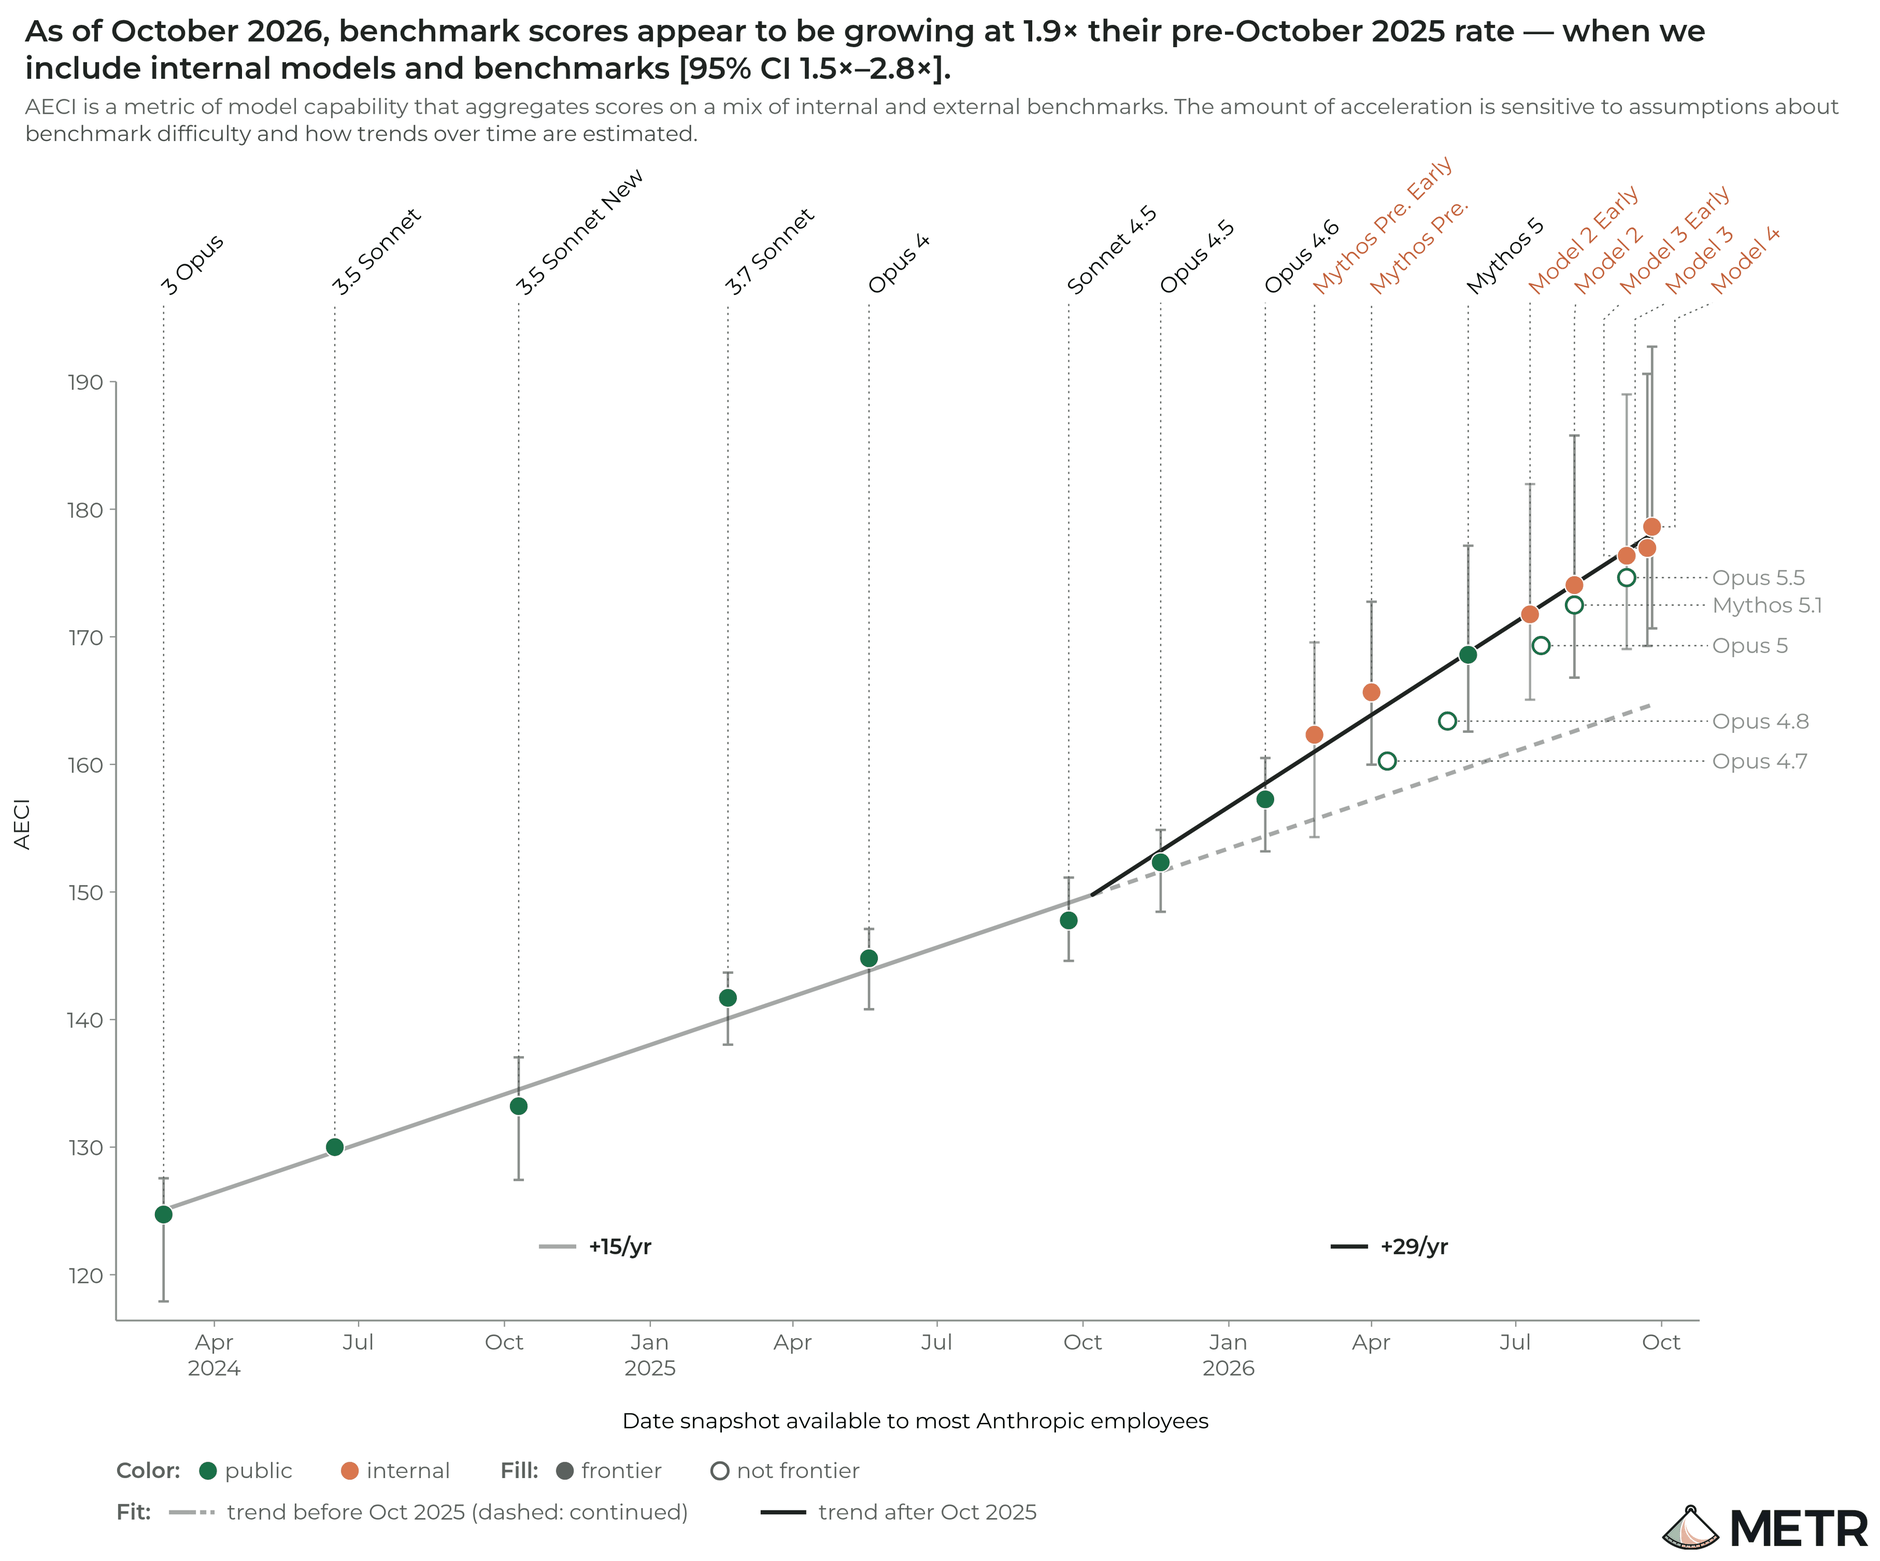
On November 5, METR published an assessment based on high-access work at Anthropic from August 12 to October 29. It estimates that capabilities on well-specified tasks were improving at roughly twice the earlier rate as of October. The report’s AECI benchmark trend accelerated 1.9x, with a 95% confidence interval of 1.5–2.8x.
What remains uncertain
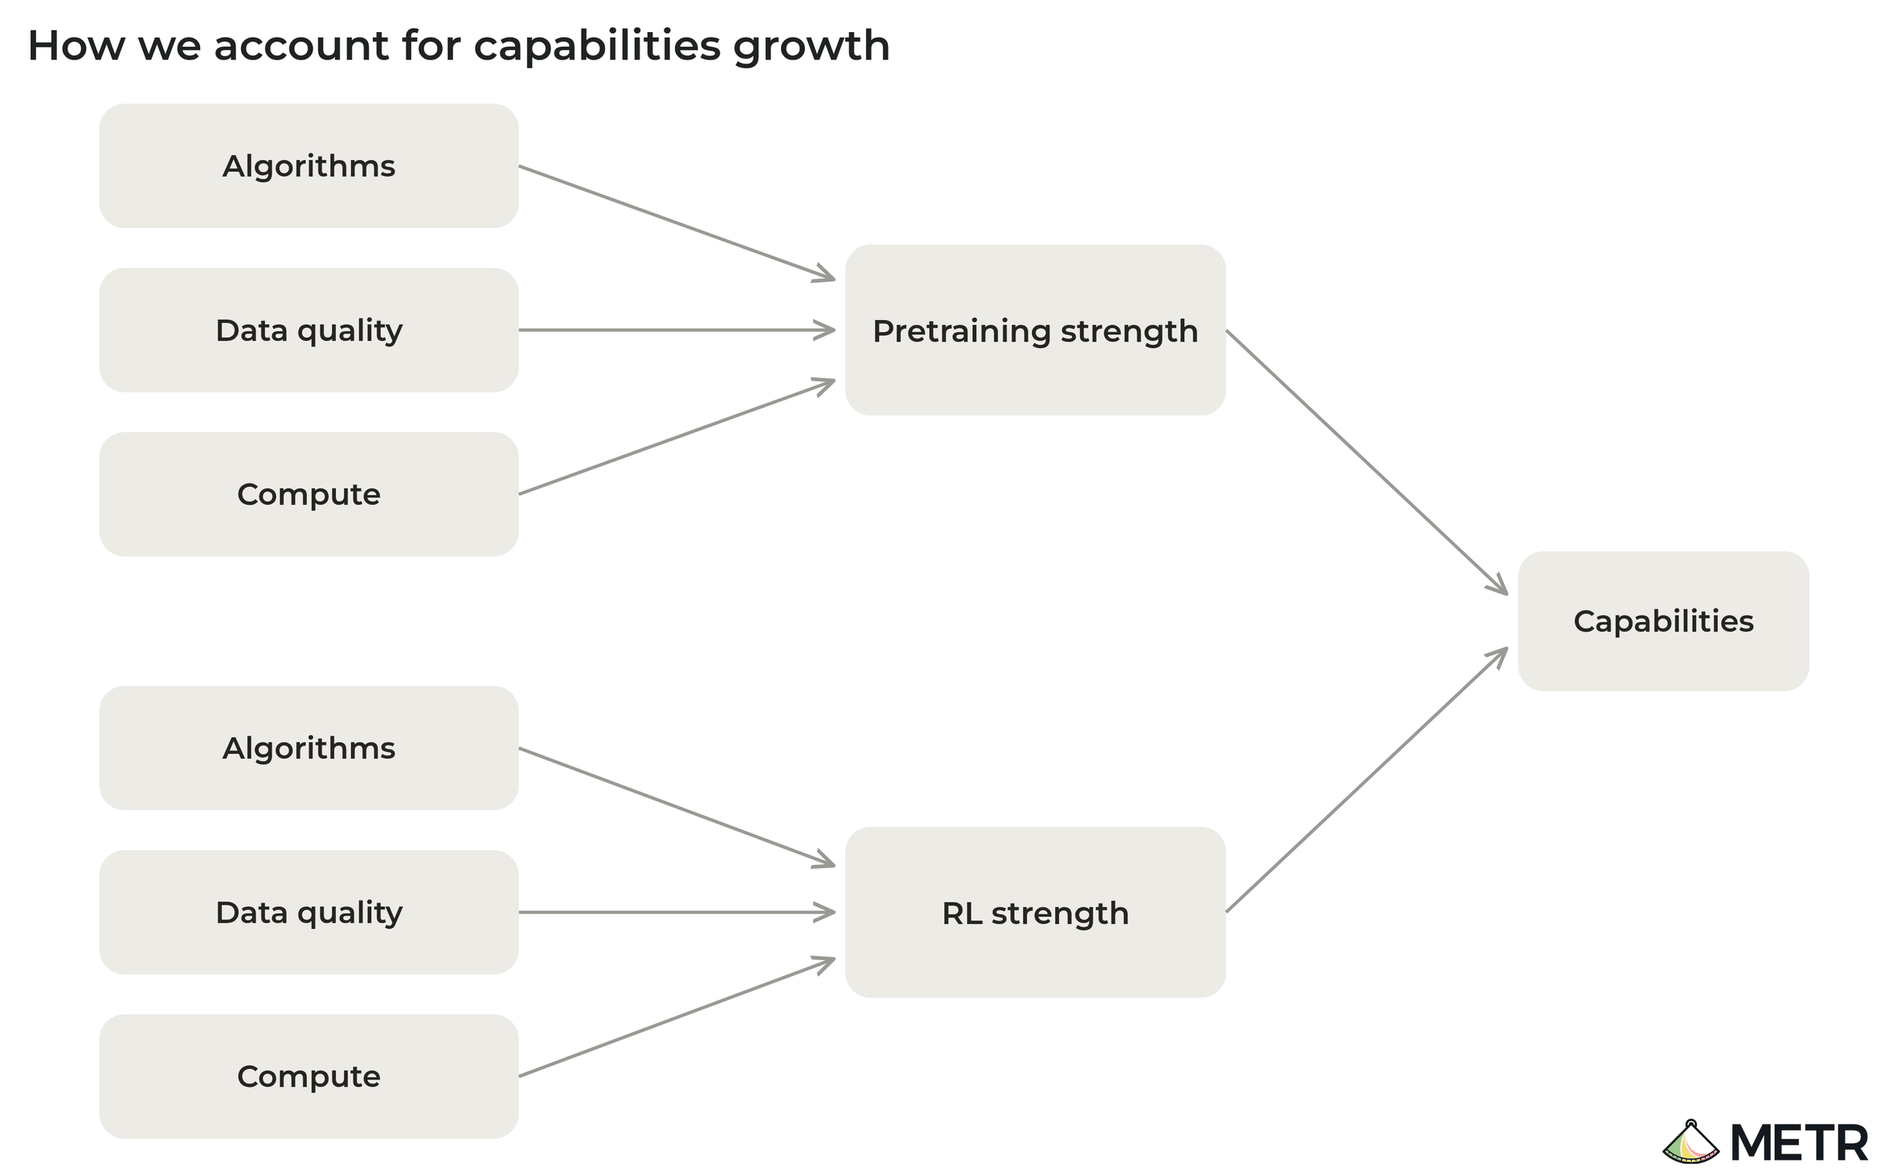
METR judges that AI likely explains a majority of the current acceleration, while acknowledging other contributors and wide uncertainty. It says faster growth in training compute does not explain the observed acceleration. Much of the evidence important to its conclusions was redacted by Anthropic, limiting public scrutiny. Assistance to researchers remains central; this is not evidence that an autonomous system completed every stage of AI development.
How to use the finding
Our reading: ask which process improved, how the baseline was chosen and whether results survive independent checks. A faster benchmark trend does not directly estimate your team’s productivity, establish a date for a future model or prove an unlimited self-improvement loop. For a practical follow-up, compare one research task with and without assistance while keeping review standards identical.
How to read the acceleration claim
Think of acceleration here as a comparison between rates of improvement. It is not a claim that a model answers every question twice as well or that each researcher finishes every job in half the time. The distinction changes what a reader can reasonably do with the headline.
A hypothetical example: suppose an internal score rose by four points over one period and eight points over an equally long later period. Its point gain per period doubled. That arithmetic says nothing by itself about how much human labor was saved, whether the score will keep rising, or which intervention caused the change. Real capability metrics can be more complicated; this example only illustrates why a rate and a level should not be treated interchangeably.
Why the counterfactual matters
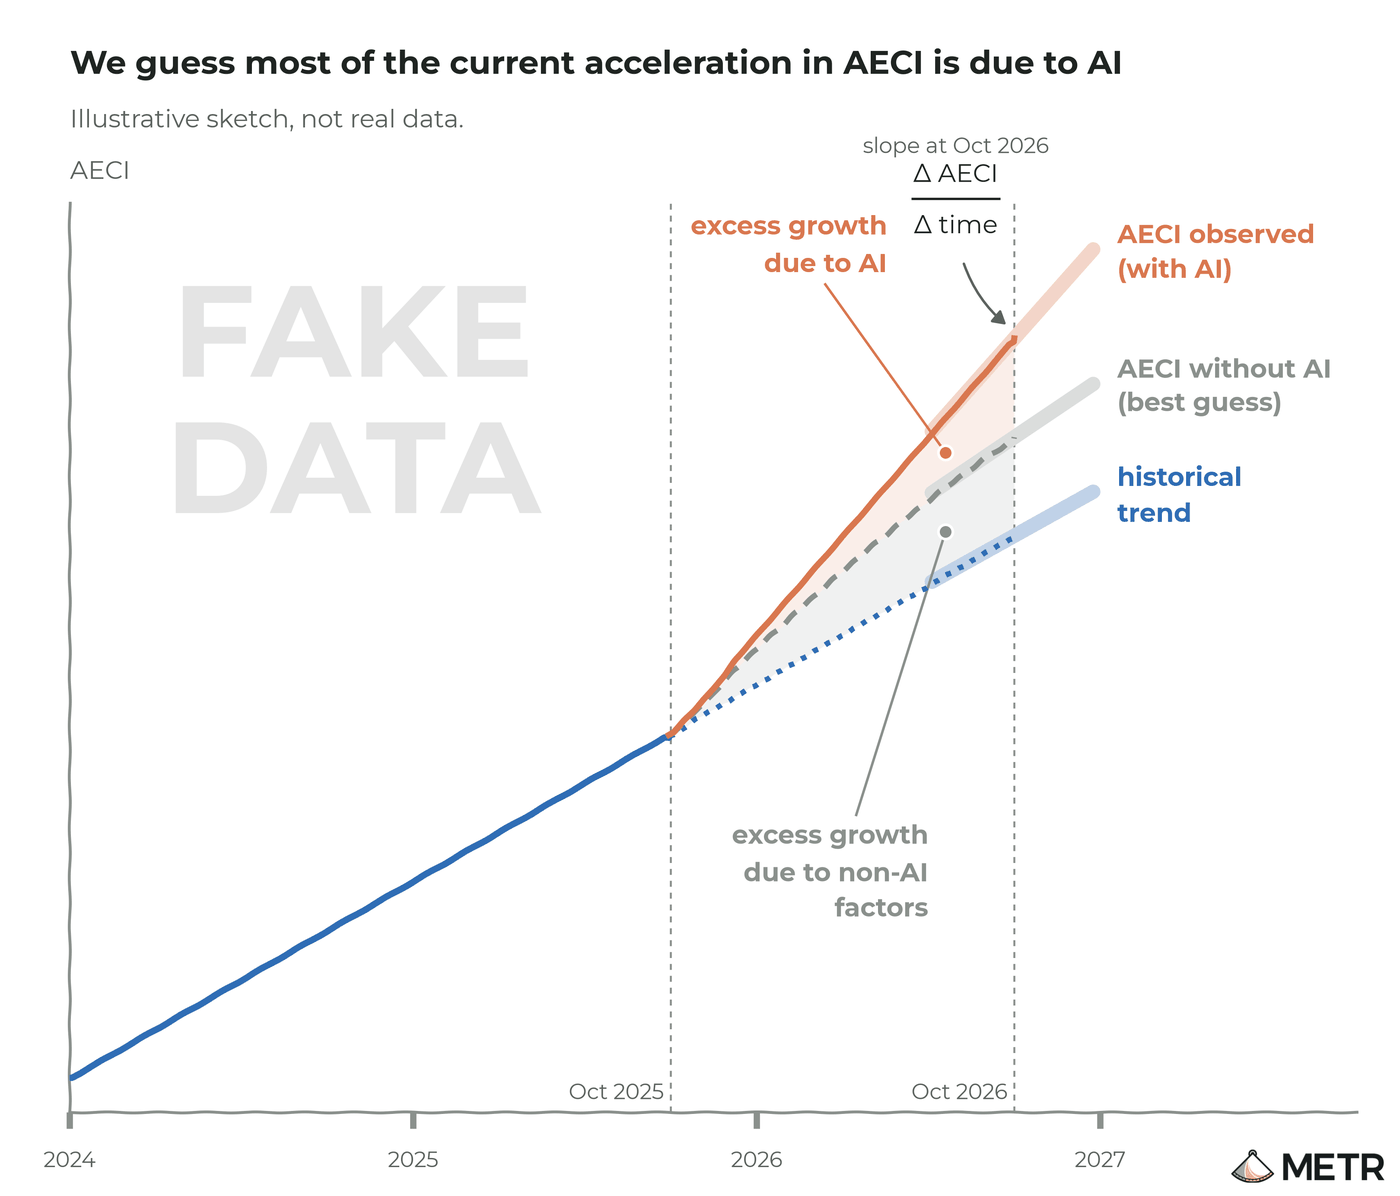
To attribute an improvement to AI assistance, we need a defensible picture of what would have happened without it. A visible upward trend is compatible with several explanations: better tooling, a different research mix, more capable staff, more resources, or interactions between them. A counterfactual is therefore a causal assumption to scrutinize, not another measurement that can simply be read from the observed curve.
The sketch makes that problem visible. Ask which comparison is being made before interpreting a multiplier. Also separate uncertainty about the measured trend from uncertainty about its cause: a narrow estimate for a slope would not automatically make the attribution equally certain.
A capability trend is different from a task time horizon
METR’s separate time-horizon explainer describes task difficulty in terms of how long a human expert would need, at a specified AI success rate. It is not a stopwatch for how long an agent runs unattended. The page also warns that its charts are no longer actively updated. Do not combine an old task-horizon chart with this research-acceleration estimate as though they were one live metric.
What a small team can actually test
Pick a repeatable task such as reviewing a data-cleaning script. Give comparable examples to an assisted workflow and your usual workflow, and decide the acceptance criteria before seeing the answers. Record elapsed effort, review effort and escaped mistakes separately. If a faster draft needs longer checking, the draft time alone will overstate the useful gain.
Our interpretation is that the report raises a serious question about research workflows, rather than supplying a multiplier to paste into a business plan. The most informative follow-up is evidence of which steps improved and which checks still required people. Compare this with a specific model-weight repair experiment, where the intervention and its limits can be examined more narrowly.
Read the source: METR.
Reviewed November 15, 2026. Discovery credit: JoCoding’s November 8 IT NEWS briefing. This brief independently checks the linked primary source and distinguishes the announcement date from this article’s publication date.
Discussion