Code Lab
Chrome DevTools MCP Explained: Browser Debugging for AI Coding Agents
CODE LAB · PROJECT SPOTLIGHT
Chrome DevTools MCP TypeScript · Apache 2.0
Connect browser symptoms to console errors, network requests and performance traces.
Repository preview/artwork: ChromeDevTools/chrome-devtools-mcp · creator-supplied image.
Chrome DevTools MCP gives a coding agent tools to inspect a real browser session. The useful step beyond reading source is evidence: a console error, failed request, rendered screenshot or performance trace can show what the application actually did.
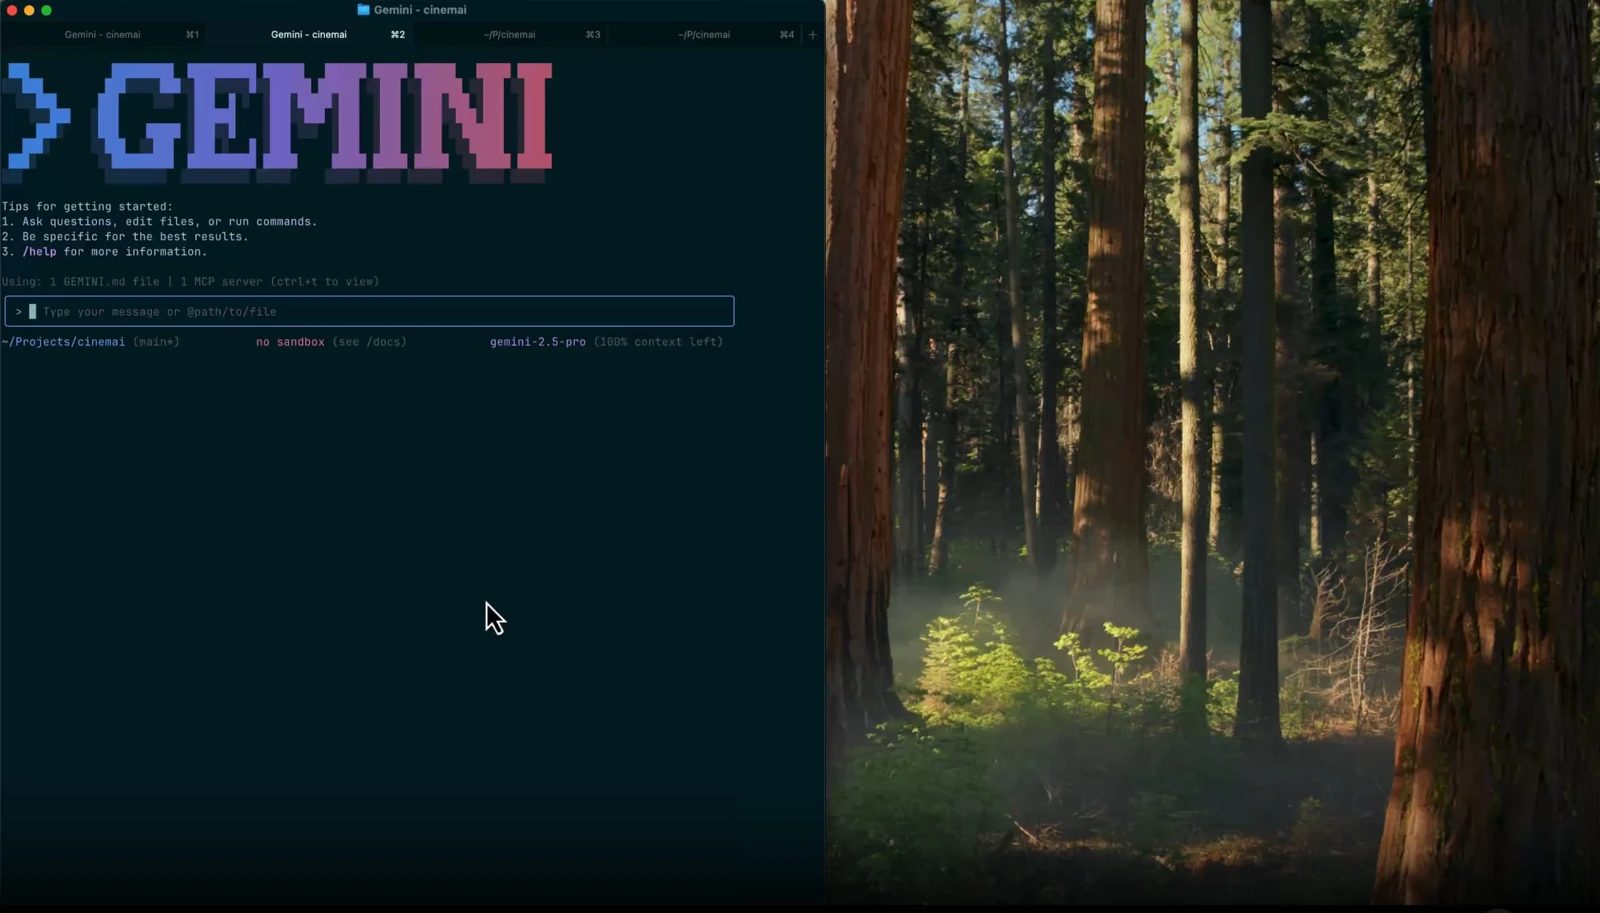
The public ChromeDevTools project is available as an MCP server and a CLI. We inspected its documentation and implementation, but did not install it or attach it to a browser. The images here are Google’s published examples, separate from any hands-on result.
Ask for evidence before asking for a fix
A useful prompt identifies a page, a reproducible action and an expected result. “Make the site faster” is harder to assess than “reproduce this slow image load and identify the request or rendering work that delays the main content.”
| Observation | What it reveals | What to verify |
|---|---|---|
| Screenshot or page state | A missing element, broken layout or unexpected navigation | Reproduce with the same viewport and input. |
| Console messages | Runtime errors and relevant stack traces | Connect the error to the user action. |
| Network requests | Failed resources, responses and request timing | Identify the request belonging to this reproduction. |
| Performance trace | Work on the critical rendering path | Repeat the same scenario after the change. |
A screenshot establishes a symptom without necessarily explaining its cause. Pair it with relevant console or network evidence before changing code. After a revision, reproduce the same action rather than assuming that the patch resolved the visible problem.
Start with the documented MCP configuration
The repository requires a supported Node.js LTS environment, npm and a supported Google Chrome or Chrome for Testing installation. Its basic configuration uses npx to start the package:
{
  "mcpServers": {
    "chrome-devtools": {
      "command": "npx",
      "args": ["-y", "chrome-devtools-mcp@latest"]
    }
  }
}
This is a configuration example, not an installation performed for this article. Follow the client-specific guide ↗ for where it belongs. The README notes that connecting the server alone does not necessarily open a browser; a tool requiring a running instance starts it.
The @latest tag follows the current package. Record the installed package and browser versions for a reproducible investigation. The release listing showed chrome-devtools-mcp-v1.13.0, dated November 11. This introduction is not announcing a release that happened today.
Choose the testing session deliberately
Browser inspection can expose page content and request details to the connected agent. Begin with a dedicated test session that does not require private account information. The configuration guide documents isolated-session options; attaching an existing everyday browser is a separate choice.
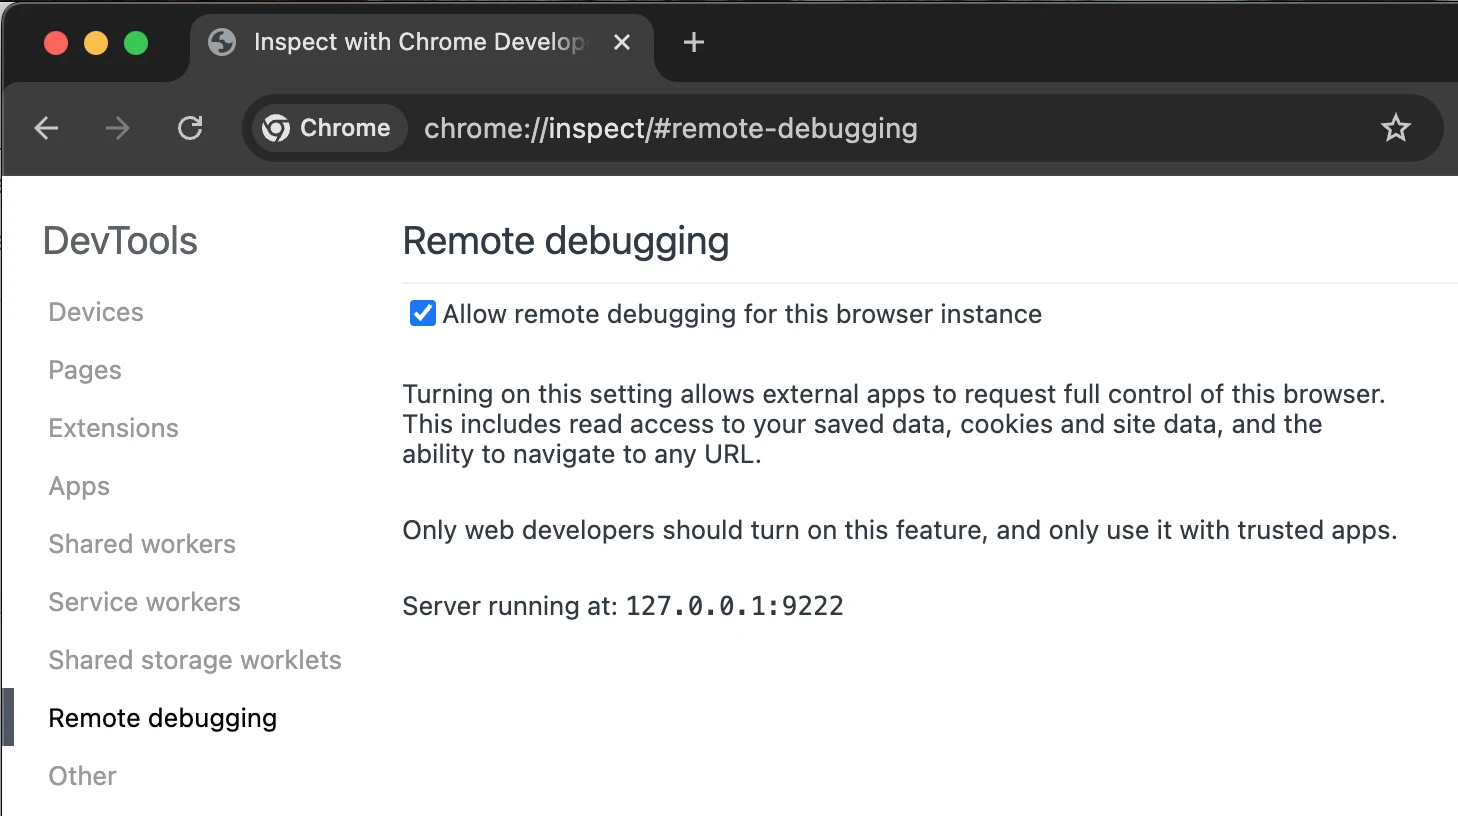
The server’s usage statistics and Chrome browser metrics are separate settings. The README documents --no-usage-statistics to opt out of server collection. It also says performance tools may send trace URLs to the CrUX API; --no-performance-crux disables that lookup. These controls do not make every part of an agent workflow offline.
Inside the source: keeping the network view scoped
The request-list tool passes explicit pagination and filtering options to its response builder:
The handler obtains the page’s DevTools context. When a selected CDP request ID is available, it resolves it into the tool’s request identifier. The response includes network requests using the requested page size, index, resource types and preserved-request setting.
The declaration above this excerpt describes requests since the last navigation; retaining earlier navigations is an explicit option. That helps keep an unrelated request from another page out of an investigation. This function prepares evidence. It does not diagnose the root cause or repair application code.
Actual source: Copyright 2025 Google LLC, ChromeDevTools/chrome-devtools-mcp at the linked commit. Apache License 2.0; original line numbers and syntax coloring added. Repository license ↗
Keep lab traces and real-user data separate
A trace describes one run’s device, cache, network and interaction conditions. CrUX field data describes a different population and time window. Label those observations separately and preserve the application revision when comparing results.
A plausible bottleneck is the start of an investigation, not proof that a faster result has been achieved. Check the rendered page and relevant behavior after the fix. For analyzing the code change itself, our Alibaba Open Code Review walkthrough covers a different stage.
Continue with the official repository ↗, releases ↗ and configuration reference ↗.
Reviewed November 17, 2026. Discovery lead: Mindung’s Short ↗. Primary documentation and source checked independently. No server connection, browser debugging run or performance measurement is claimed.
Discussion